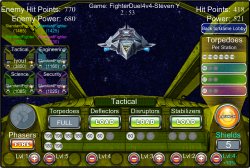

MathScore EduFighter is one of the best math games on the Internet today. You can start playing for free!
Ohio Math Standards - 5th Grade
MathScore aligns to the Ohio Math Standards for 5th Grade. The standards appear below along with the MathScore topics that match. If you click on a topic name, you will see sample problems at varying degrees of difficulty that MathScore generated. When students use our program, the difficulty of the problems will automatically adapt based on individual performance, resulting in not only true differentiated instruction, but a challenging game-like experience.
Want unlimited math worksheets? Learn more about our online math practice software.
View the Ohio Math Standards at other levels.
Meaning of Operations
* Represent and compare numbers less than 0 by extending the number line and using familiar applications; e.g., temperature, owing money. (Compare Mixed Values 2 , Compare Integers )* Use order of operations, including use of parentheses, to simplify numerical expressions. (Using Parentheses , Order Of Operations )
* Use commutative, associative, distributive, identity and inverse properties to simplify and perform computations. (Addition Grouping , Associative Property 1 , Associative Property 2 , Commutative Property 2 , Basic Distributive Property )
* Identify and use relationships between operations to solve problems. (Missing Factor , Missing Term , Missing Operator , Compare Expressions )
* Justify why fractions need common denominators to be added or subtracted.
* Explain how place value is related to addition and subtraction of decimals; e.g., 0.2 + 0.14; the two tenths is added to the one tenth because they are both tenths.
Number and Number Systems
* Use models and visual representation to develop the concept of ratio as part-to-part and part-to-whole, and the concept of percent as part-to-whole. (Percentage Pictures , Ratios )* Identify and generate equivalent forms of fractions, decimals and percents. (Fraction Simplification , Fractions to Decimals , Decimals To Fractions , Compare Mixed Values , Positive Number Line , Percentages )
* Recognize and identify perfect squares and their roots. (Estimating Square Roots , Perfect Squares )
* Round decimals to a given place value and round fractions (including mixed numbers) to the nearest half. (Decimal Rounding to .01 , Decimal Rounding )
Computation and Estimation
* Use physical models, points of reference, and equivalent forms to add and subtract commonly used fractions with like and unlike denominators and decimals. (Basic Fraction Addition , Fraction Addition , Basic Fraction Subtraction , Fraction Subtraction , Decimal Addition , Decimal Subtraction )Measurement Units
* Identify and select appropriate units to measure angles; i.e., degrees.* Identify paths between points on a grid or coordinate plane and compare the lengths of the paths; e.g., shortest path, paths of equal length. (Line Segments )
* Demonstrate and describe the differences between covering the faces (surface area) and filling the interior (volume) of three-dimensional objects.
* Demonstrate understanding of the differences among linear units, square units and cubic units.
Use Measurement Techniques and Tools
* Make conversions within the same measurement system while performing computations. (Distance Conversion , Time Conversion , Volume Conversion , Weight Conversion , Temperature Conversion )* Use strategies to develop formulas for determining perimeter and area of triangles, rectangles and parallelograms, and volume of rectangular prisms. (Triangle Area , Parallelogram Area , Perimeter , Rectangular Solids )
Characteristics and Properties
* Use standard language to describe line, segment, ray, angle, skew, parallel and perpendicular.* Label vertex, rays, interior and exterior for an angle.
* Use physical models to determine the sum of the interior angles of triangles and quadrilaterals. (Triangle Angles , Quadrilateral Angles )
* Describe and use properties of congruent figures to solve problems.
Visualization and Geometric Models
* Understand that the measure of an angle is determined by the degree of rotation of an angle side rather than the length of either side.* Predict what three-dimensional object will result from folding a two-dimensional net, then confirm the prediction by folding the net.
Use Patterns, Relations and Functions
* Justify a general rule for a pattern or a function by using physical materials, visual representations, words, tables or graphs. (Function Tables , Function Tables 2 )* Use calculators or computers to develop patterns, and generalize them using tables and graphs.
Use Algebraic Representations
* Use variables as unknown quantities in general rules when describing patterns and other relationships. (Function Tables , Function Tables 2 )* Create and interpret the meaning of equations and inequalities representing problem situations. (Arithmetic Word Problems )
* Model problems with physical materials and visual representations, and use models, graphs and tables to draw conclusions and make predictions. (Requires outside materials )
Analyze Change
* Describe how the quantitative change in a variable affects the value of a related variable; e.g., describe how the rate of growth varies over time, based upon data in a table or graph. (Independent and Dependent Variables )Data Collection
* Read, construct and interpret frequency tables, circle graphs and line graphs. (Line Graphs )* Modify initial conclusions, propose and justify new interpretations and predictions as additional data are collected.
* Read and interpret increasingly complex displays of data, such as double bar graphs.
* Select and use a graph that is appropriate for the type of data to be displayed; e.g., numerical vs. categorical data, discrete vs. continuous data.
* Determine appropriate data to be collected to answer questions posed by students or teacher, collect and display data, and clearly communicate findings.
Statistical Methods
* Determine and use the range, mean, median and mode, and explain what each does and does not indicate about the set of data. (Mean, Median, Mode )Probability
* List and explain all possible outcomes in a given situation.* Identify the probability of events within a simple experiment, such as three chances out of eight. (Probability )
* Use 0,1 and ratios between 0 and 1 to represent the probability of outcomes for an event, and associate the ratio with the likelihood of the outcome. (Probability , Probability 2 )
* Compare what should happen (theoretical/expected results) with what did happen (experimental/actual results) in a simple experiment.
* Make predictions based on experimental and theoretical probabilities. (Batting Averages )
Learn more about our online math practice software.

|
"MathScore works."
- John Cradler, Educational Technology Expert |